
What is NIFTY PB Ratio?
- Feb 29, 2020
- 2 min read
Updated: Sep 20, 2020
How to analyse the average Price-Book (PB Ratio) of NIFTY 50 Index !!
Price to book value measures the enterprise value of the company. It is considered to be more stable than P/E ratio in a volatile market.
As with Nifty PE ratio, the price-book (P/B) ratio of the NIFTY 50 Index can also help an investor to gauge the relative valuation of the Index against its own historical record or to compare against other aggregate Indices.
“P/B Formula = Market Price per share / Book Value per share”
From an individual company perspective, book value is also the net asset value of a company calculated as total assets minus intangible assets (patents, goodwill) and liabilities. For the initial outlay of an investment, book value may be net or gross of expenses, such as trading costs, sales taxes, and service charges.
A lower P/B ratio could mean the stock is undervalued. However, it could also mean something is fundamentally wrong with the company. As with most ratios, this varies by industry.
The P/B ratio also indicates whether you're paying too much for what would remain if the company went bankrupt immediately.
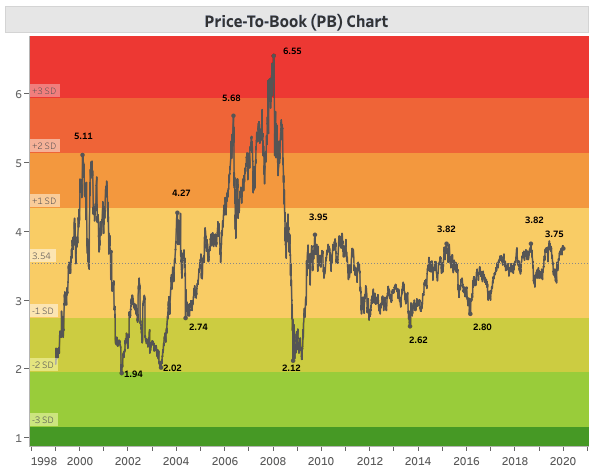
Normally, the Nifty P/B ratio remains between 2 and 5 (It crossed 6 in 2008 - A sign of the highly overvalued market - as can bee seen in the Nifty PB chart above).

From long term perspective, Nifty is considered to be in oversold range when Nifty P/B multiple is below 2.5 and is considered to be in overvalued range when Nifty P/B is above 4. Hence, low Nifty P/B ratio is considered cheap and ideal for going long. A high Nifty PB multiple on the other hand is assumed to be expensive and warrants caution while taking investment decisions.
As can be seen from the chart below, the market quickly bounces back from the oversold region because intelligent investors start buying stocks looking to snatch up bargains and they do the exact opposite when Nifty P/B is in the overbought region.

Hence, investors should not judge nifty index or sensex by its value. Nifty at 12000 and Sensex at 32000 are mere numbers and not that helpful in making an investment decision. Whether the index is cheap or expensive should be judged on the basis of its PE ratio, in combination with the PB ratio and Dividend Yield rather than the absolute value.
Note: Investors can analyse Nifty PE, Nifty PB and Nifty Dividend Yield values from an historical perspective to gauge the overall valuation of market and can make sensible investment decisions and safeguard their investment portfolio. Nifty P/E analysis can be used as the primary indicator and Nifty P/B and Nifty Dividend Yield values can be used to confirm the observation. If all the three are pointing towards the same conclusion (Overvaluation or Undervaluation), investors can be fairly sure about their investment decisions, i.e. going long when the market is undervalued and booking profit when the market is overvalued.

Comments