
What is NIFTY PE Ratio?
- Mar 4, 2020
- 3 min read
Updated: Sep 20, 2020
How to analyse the average Price-Earnings (PE Ratio) of NIFTY 50 Index !!
The price earnings (P/E) ratio of the NIFTY 50 Index can help an investor understand the average valuation of 50 large-cap stocks that form part of the index. It is used by investors and analysts to determine the relative value of the index against its own historical record or to compare against other aggregate markets (viz Sensex, S&P 500, Bank Nifty, Nifty IT, Nifty Next 50, Nifty Midcap 150, Nifty Smallcap 250, Nifty 500 etc) over time.

Nifty PE ratio measures the average PE ratio of the Nifty 50 companies covered by the Nifty Index. PE ratio is also known as "price multiple" or "earnings multiple".
“P/E Formula = Index Market Capitalisation / Gross Earnings” where Index market capitalisation is the sum total of the outstanding equity shares or units considered for index computation multiple by the last traded price of each index constituent.
The current Nifty P/E ratio is 28, it means Nifty is 28 times its earnings - implies that investors are willing to pay INR 28 for one rupee profit collectively earned by all the companies that are included in Nifty

Value Investing by using NIFTY PE Ratio
Nifty PE ratio is important as it is a measure of valuation of all the companies included in Nifty. If we learn how to interpret the overall value of stocks by using the P/E ratio we can gain insights into the future direction of equity prices.
From long term perspective, Nifty is considered to be in oversold range when Nifty PE value is below 14 and it's considered to be in overvalued range when Nifty PE is near or above 22. Hence, low Nifty P/E ratio is considered cheap and ideal for going long. A high Nifty PE multiple on the other hand is assumed to be expensive and warrants caution while taking investment decisions.
As can be seen from the chart below, the market quickly bounces back from the oversold region because intelligent investors start buying stocks looking to snatch up bargains and they do the exact opposite when Nifty P/E is in the overbought region.

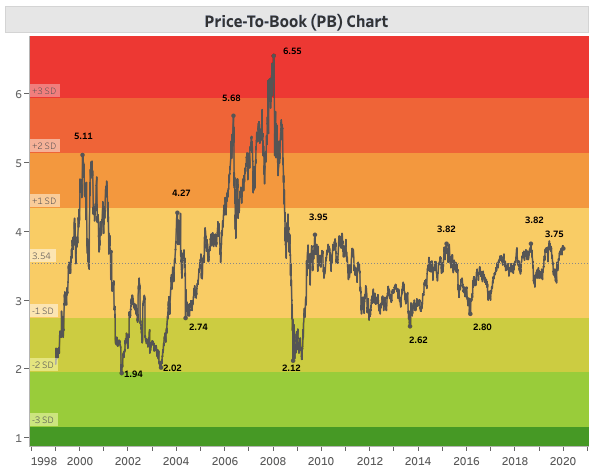
Hence, investors should not judge nifty index or sensex by its value. Nifty at 12000 and Sensex at 32000 are mere numbers and not that helpful in making an investment decision. Whether the index is cheap or expensive should be judged on the basis of its PE ratio, in combination with the PB ratio and Dividend Yield rather than the absolute value.

Note: Investors can analyse Nifty PE, Nifty PB and Nifty Dividend Yield values from an historical perspective to gauge the overall valuation of market and can make sensible investment decisions and safeguard their investment portfolio. Nifty P/E analysis can be used as the primary indicator and Nifty P/B and Nifty Dividend Yield values can be used to confirm the observation. If all the three are pointing towards the same conclusion (Overvaluation or Undervaluation), investors can be fairly sure about their investment decisions, i.e. going long when the market is undervalued and booking profit when the market is overvalued.
* Generally, there are two variations of the PE ratio; one being the Trailing PE ratio and the other being Forward PE ratio. The Trailing PE ratio uses the earnings of the last 12 months, while the Forward PE uses the expected earnings for the next 12 months. The Forward PE requires estimating the forward earnings and hence, is prone to estimation errors. Moreover, the same is not easily available, while the Trailing PE ratio which is used in this article is easily available on the NSE India website (https://www.nseindia.com)
Comments